
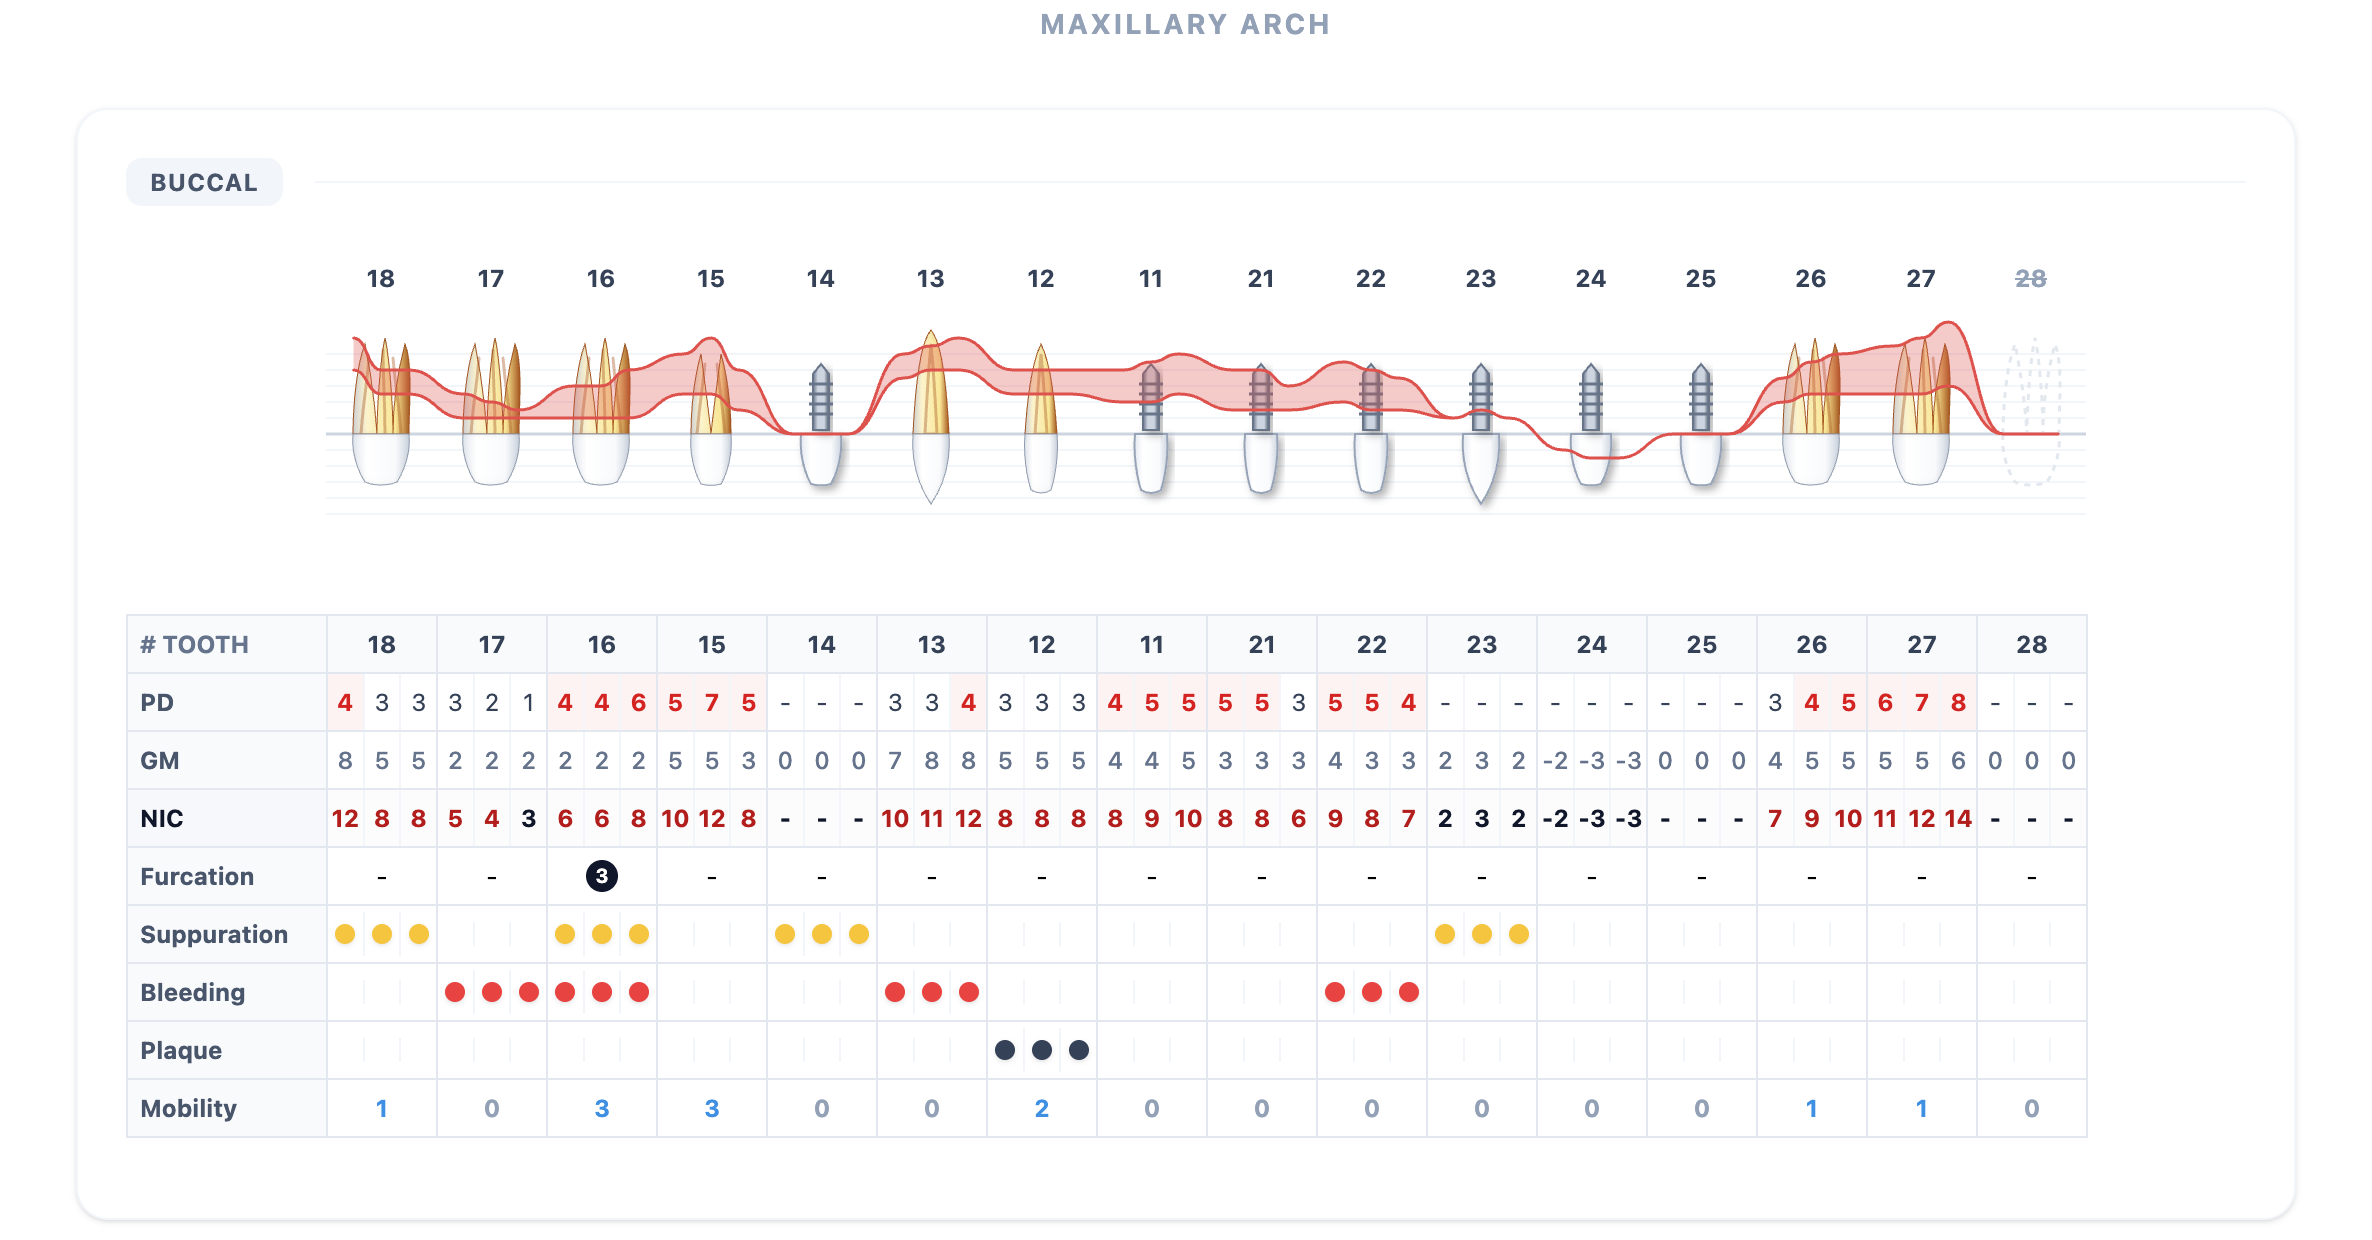
What does the chart record?
The record combines probing measurements with findings linked to a tooth or examination site. In PerioVox, you can document probing depths, gingival margin or recession, bleeding, suppuration, plaque, mobility, furcation and notes. Tooth status matters too: a natural tooth, an implant and a missing tooth are represented differently.
| Record | What it contributes |
|---|---|
| Probing depth | A measurement in millimetres linked to an examined site. |
| Gingival margin or recession | The margin position, recorded using the chosen convention. |
| Bleeding, plaque and suppuration | Findings recorded alongside measurements. |
| Mobility and furcation | Tooth-specific observations. |
| Tooth status | Identification of teeth, implants and missing teeth. |
Teeth, surfaces and sites.
Detailed charting can record six sites per tooth: three on the buccal side and three on the lingual or palatal side. Identifying each site makes it possible to revisit and compare its records. A number alone is not enough without knowing its tooth and surface.
The clinician determines the appropriate examination and recording protocol. Periodontal screening and detailed charting serve different purposes; a screening score alone does not describe all changes at an individual site between visits.
From paper to a digital periodontal chart.
A paper chart requires measurements to be transcribed and retained. A digital record organizes them for review, visit comparisons and reports. Its value depends on accurately reflecting the examination, whichever recording method is used.
PerioVox adds voice entry: probe with your usual instrument, speak your measurements and review the resulting chart. Correct a value or return to a previous tooth when needed. Voice is the input method; the probe and the professional’s judgment remain essential.
- Create your free PerioVox account and open the correct patient and visit record.
- Choose ADA or FDI tooth numbering and prepare the microphone on a compatible device.
- Examine with your everyday probe and dictate the measurements and findings you want to record.
- Review the teeth, sites and values on screen. Correct discrepancies before using the record for follow-up or reports.
How to review the record.
A graph helps visualize the record, but does not determine a diagnosis or treatment on its own. Interpretation belongs to the dental professional.
- Check tooth identification and the selected ADA or FDI numbering system.
- Confirm that measurements and findings match the examined sites.
- Distinguish unrecorded data from measured values; a missing entry is not a normal result.
- Compare visits while retaining the context of each examination.
What can you do with PerioVox?
PerioVox is free and always will be. It runs in a web browser, understands dictation in 97 languages and offers its app interface in English, Spanish and French. After charting, compare visits, work with Lang and IDRA diagrams, generate QR-access patient reports and export CSV records.
Voice entry does not replace the probe or the examination. You measure, you say the values, and you review what appears. The site does not publish a stopwatch claim for how many minutes a chart takes.
How to read pocket depth, recession and attachment.
Probing depth is the distance, in millimetres, from the gingival margin to the base of the sulcus or pocket at that site. A number is useful only when the tooth and the site are known. Detailed charting uses six sites: three buccal and three lingual or palatal.
Recession, or the gingival margin, records where the margin sits relative to a reference such as the cementoenamel junction. If the margin has moved apically, pocket depth alone understates the attachment that has been lost.
Clinical attachment level describes that position. The University of Bern periodontal chart calculates attachment level as probing depth minus the gingival-margin value, with the sign convention explained on its site. PerioVox documents probing depths and gingival margin or recession. It does not state that it calculates attachment level. Interpretation stays with the clinician.
Bleeding on probing is bleeding noted when a site is probed. Plaque and suppuration are recorded with the measurements. A bleeding percentage summarizes sites. It is not a diagnosis of each one.
Mobility and furcation.
Mobility and furcation belong to the tooth, not to a seventh pocket number. The Bern calibration notes describe mobility grades 0 to 3 after Miller (1950): physiological movement, increased horizontal movement up to 1 mm, horizontal movement of more than 1 mm, and severe vertical movement. Furcation grades 0 to 3 follow Hamp, Nyman and Lindhe (1975), from an entrance that cannot be detected to a through-and-through furcation.
PerioVox can record mobility and furcation with the other findings. It does not state that it assigns those grades. Record the grade your examination supports, and check that it sits on the intended tooth.
Where the 2017 AAP/EFP classification fits.
The 2017 World Workshop, co-presented by the American Academy of Periodontology and the European Federation of Periodontology, describes periodontitis with a stage and a grade. The Academy states that staging indicates severity and the complexity of management, and that grading considers biologic characteristics, including smoking and diabetes, when estimating progression. Initial staging uses clinical attachment loss when it is available.
A periodontal chart supplies the site-level measurements used in that review. It does not, by itself, decide stage or grade. Radiographs, tooth loss due to periodontitis and the medical history are not a pocket-depth column. PerioVox does not state that it assigns an AAP stage or grade.
The Bern periodontal chart.
The Periodontal Chart Online from the University of Bern, associated with Prof. Christoph A. Ramseier, is a browser chart. It records probing depth and gingival margin, calculates attachment level, and can record bleeding on probing, plaque, mobility, furcation and implants. Its help text documents voice-command examples, in English, for tooth status, mobility, implants, furcation and bleeding or plaque. A price is not stated on that page. It asks anyone using it in research to cite periodontalchart-online.com, Ramseier CA (2025).
PerioVox is a separate product: voice charting in 97 dictation languages, in the browser, free for the clinician, with visit comparison, patient reports and CSV export. The Bern chart is a public reference for how a chart is read. This page does not claim the two calculate attachment in the same way.
How voice charting changes the recording.
With paper or a keyboard, someone looks away from the mouth to enter each site. PerioVox is built so the clinician can probe with an everyday instrument, dictate the measurements and review them on screen, without a second person typing. A correction can return to an earlier tooth. That is the claim the site makes. It does not promise a number of minutes saved.
The same record can be compared across visits and exported as CSV. If you are choosing among voice products, the comparison page lists only what each vendor publishes.
Frequently asked questions
Is a periodontal chart the same as a dental chart?
No. A periodontal chart documents periodontal measurements and findings. An odontogram represents other dental findings and treatments. Their roles complement one another.
What does a periodontal chart record?
Site-level probing depths and findings such as gingival margin or recession, bleeding, suppuration and plaque, plus tooth-level notes such as mobility, furcation and whether the tooth is an implant or missing. PerioVox can document those items. It does not state that it calculates clinical attachment level.
How do I read pocket depth and recession?
Pocket depth is the millimetre distance from the gingival margin to the base of the pocket. Recession records where that margin sits. Attachment loss can be greater than the pocket depth when the margin has receded. A missing entry is not a healthy site.
Does the 2017 classification replace the chart?
No. Staging and grading use chart measurements together with attachment loss, radiographs, tooth loss and risk factors. The chart does not assign a stage by itself, and PerioVox does not state that it assigns one.
Is the Bern periodontal chart the same as PerioVox?
No. The University of Bern publishes a browser chart that calculates attachment level and documents voice commands. PerioVox is free voice charting software, with dictation in 97 languages. They are separate tools.
Can I create a periodontal chart for free?
Yes. PerioVox lets you create digital periodontal charts by voice for free, and will remain free. Use your everyday probe and a compatible device with a microphone.
Does PerioVox measure periodontal pockets automatically?
No. The clinician performs the probing and dictates the measurements. PerioVox structures the voice record; it does not perform the examination.
Sources and documentation
Information for dental professionals. Records and support tools require clinical review; they do not replace diagnosis or treatment decisions.